


Regional High School District 01, Connecticut
About
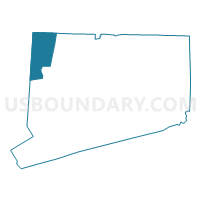
Outline

Summary
| Unique Area Identifier | 194584 |
| Name | Regional High School District 01 |
| State | Connecticut |
| Area (square miles) | 268.27 |
| Land Area (square miles) | 263.00 |
| Water Area (square miles) | 5.27 |
| % of Land Area | 98.03 |
| % of Water Area | 1.97 |
| Latitude of the Internal Point | 41.88239630 |
| Longtitude of the Internal Point | -73.37684380 |
| Total Population | 15,471 |
| Total Housing Units | 9,406 |
| Total Households | 6,800 |
| Median Age | 49.5 |
Maps
Graphs
Select a template below for downloading or customizing gragh for Regional High School District 01, Connecticut


Neighbors
Neighoring Secondary School District (by Name) Neighboring Secondary School District on the Map
Top 10 Neighboring County (by Population) Neighboring County on the Map
- Fairfield County, CT (916,829)
- Dutchess County, NY (297,488)
- Litchfield County, CT (189,927)
- Berkshire County, MA (131,219)
Top 10 Neighboring County Subdivision (by Population) Neighboring County Subdivision on the Map
- New Milford town, Litchfield County, CT (28,142)
- Dover town, Dutchess County, NY (8,699)
- Amenia town, Dutchess County, NY (4,436)
- Salisbury town, Litchfield County, CT (3,741)
- Sherman town, Fairfield County, CT (3,581)
- Washington town, Litchfield County, CT (3,578)
- North Canaan town, Litchfield County, CT (3,315)
- Sheffield town, Berkshire County, MA (3,257)
- North East town, Dutchess County, NY (3,031)
- Kent town, Litchfield County, CT (2,979)
Top 10 Neighboring Place (by Population) Neighboring Place on the Map
- Canaan CDP, CT (1,212)
- New Preston CDP, CT (1,182)
- Lakeville CDP, CT (928)
- Sharon CDP, CT (729)
- Falls Village CDP, CT (538)
Top 10 Neighboring Elementary School District (by Population) Neighboring Elementary School District on the Map
- Salisbury School District, CT (3,741)
- Sherman School District, CT (3,581)
- North Canaan School District, CT (3,315)
- Kent School District, CT (2,979)
- Sharon School District, CT (2,782)
- Norfolk School District, CT (1,709)
- Cornwall School District, CT (1,420)
- Canaan School District, CT (1,234)
Top 10 Neighboring Unified School District (by Population) Neighboring Unified School District on the Map
- New Milford School District, CT (28,142)
- Taconic Hills Central School District, NY (12,275)
- Dover Union Free School District, NY (10,260)
- Southern Berkshire School District, MA (7,613)
- Regional School District 12, CT (7,567)
- Regional School District 06, CT (6,825)
- Northeast Central School District, NY (6,750)
Top 10 Neighboring State Legislative District Lower Chamber (by Population) Neighboring State Legislative District Lower Chamber on the Map
- Assembly District 103, NY (134,686)
- Fourth Berkshire District, MA (37,775)
- State House District 64, CT (23,750)
- State House District 63, CT (23,733)
- State House District 67, CT (23,716)
- State House District 66, CT (23,493)
- State House District 69, CT (23,274)
- State House District 108, CT (22,451)
Top 10 Neighboring State Legislative District Upper Chamber (by Population) Neighboring State Legislative District Upper Chamber on the Map
- State Senate District 40, NY (316,324)
- Berkshire, Hampshire & Franklin District, MA (149,418)
- State Senate District 24, CT (104,062)
- State Senate District 30, CT (102,325)
- State Senate District 8, CT (98,790)
Top 10 Neighboring 111th Congressional District (by Population) Neighboring 111th Congressional District on the Map
- Congressional District 5, CT (714,296)
- Congressional District 19, NY (699,959)
- Congressional District 20, NY (683,198)
- Congressional District 1, MA (644,956)
Top 10 Neighboring Census Tract (by Population) Neighboring Census Tract on the Map
- Census Tract 2535, Litchfield County, CT (6,114)
- Census Tract 400.01, Dutchess County, NY (4,836)
- Census Tract 100, Dutchess County, NY (4,436)
- Census Tract 400.03, Dutchess County, NY (3,863)
- Census Tract 2611, Litchfield County, CT (3,741)
- Census Tract 2571, Fairfield County, CT (3,581)
- Census Tract 2671, Litchfield County, CT (3,578)
- Census Tract 2602, Litchfield County, CT (3,315)
- Census Tract 9261, Berkshire County, MA (3,257)
- Census Tract 1000, Dutchess County, NY (3,031)
Top 10 Neighboring 5-Digit ZIP Code Tabulation Area (by Population) Neighboring 5-Digit ZIP Code Tabulation Area on the Map
- 06776, CT (26,889)
- 06759, CT (5,720)
- 12594, NY (4,275)
- 06784, CT (3,689)
- 12546, NY (3,039)
- 06018, CT (2,865)
- 06756, CT (2,853)
- 06069, CT (2,535)
- 12501, NY (2,457)
- 06757, CT (2,258)
Data
Demographic, Population, Households, and Housing Units
** Data sources from census 2010 **
Show Data on Map
Download Full List as CSV
Download Quick Sheet as CSV
| Subject | This Area | Connecticut | National |
|---|---|---|---|
| POPULATION | |||
| Total Population Map | 15,471 | 3,574,097 | 308,745,538 |
| POPULATION, HISPANIC OR LATINO ORIGIN | |||
| Not Hispanic or Latino Map | 14,966 | 3,095,010 | 258,267,944 |
| Hispanic or Latino Map | 505 | 479,087 | 50,477,594 |
| POPULATION, RACE | |||
| White alone Map | 14,826 | 2,772,410 | 223,553,265 |
| Black or African American alone Map | 182 | 362,296 | 38,929,319 |
| American Indian and Alaska Native alone Map | 35 | 11,256 | 2,932,248 |
| Asian alone Map | 130 | 135,565 | 14,674,252 |
| Native Hawaiian and Other Pacific Islander alone Map | 2 | 1,428 | 540,013 |
| Some Other Race alone Map | 102 | 198,466 | 19,107,368 |
| Two or More Races Map | 194 | 92,676 | 9,009,073 |
| POPULATION, SEX | |||
| Male Map | 7,501 | 1,739,614 | 151,781,326 |
| Female Map | 7,970 | 1,834,483 | 156,964,212 |
| POPULATION, AGE (18 YEARS) | |||
| 18 years and over Map | 12,656 | 2,757,082 | 234,564,071 |
| Under 18 years | 2,815 | 817,015 | 74,181,467 |
| POPULATION, AGE | |||
| Under 5 years | 606 | 202,106 | 20,201,362 |
| 5 to 9 years | 777 | 222,571 | 20,348,657 |
| 10 to 14 years | 856 | 240,265 | 20,677,194 |
| 15 to 17 years | 576 | 152,073 | 12,954,254 |
| 18 and 19 years | 254 | 98,761 | 9,086,089 |
| 20 years | 111 | 48,139 | 4,519,129 |
| 21 years | 105 | 46,335 | 4,354,294 |
| 22 to 24 years | 350 | 133,424 | 12,712,576 |
| 25 to 29 years | 674 | 214,145 | 21,101,849 |
| 30 to 34 years | 555 | 206,232 | 19,962,099 |
| 35 to 39 years | 716 | 222,401 | 20,179,642 |
| 40 to 44 years | 980 | 262,037 | 20,890,964 |
| 45 to 49 years | 1,331 | 291,272 | 22,708,591 |
| 50 to 54 years | 1,373 | 284,325 | 22,298,125 |
| 55 to 59 years | 1,390 | 240,157 | 19,664,805 |
| 60 and 61 years | 492 | 84,356 | 7,113,727 |
| 62 to 64 years | 786 | 118,939 | 9,704,197 |
| 65 and 66 years | 391 | 64,434 | 5,319,902 |
| 67 to 69 years | 578 | 84,847 | 7,115,361 |
| 70 to 74 years | 779 | 105,663 | 9,278,166 |
| 75 to 79 years | 602 | 89,252 | 7,317,795 |
| 80 to 84 years | 499 | 77,465 | 5,743,327 |
| 85 years and over | 690 | 84,898 | 5,493,433 |
| MEDIAN AGE BY SEX | |||
| Both sexes Map | 49.50 | 40.00 | 37.20 |
| Male Map | 48.50 | 38.50 | 35.80 |
| Female Map | 50.50 | 41.30 | 38.50 |
| HOUSEHOLDS | |||
| Total Households Map | 6,800 | 1,371,087 | 116,716,292 |
| HOUSEHOLDS, HOUSEHOLD TYPE | |||
| Family households: Map | 4,055 | 908,661 | 77,538,296 |
| Husband-wife family Map | 3,272 | 672,013 | 56,510,377 |
| Other family: Map | 783 | 236,648 | 21,027,919 |
| Male householder, no wife present Map | 249 | 59,675 | 5,777,570 |
| Female householder, no husband present Map | 534 | 176,973 | 15,250,349 |
| Nonfamily households: Map | 2,745 | 462,426 | 39,177,996 |
| Householder living alone Map | 2,226 | 373,648 | 31,204,909 |
| Householder not living alone Map | 519 | 88,778 | 7,973,087 |
| HOUSEHOLDS, HISPANIC OR LATINO ORIGIN OF HOUSEHOLDER | |||
| Not Hispanic or Latino householder: Map | 6,659 | 1,234,310 | 103,254,926 |
| Hispanic or Latino householder: Map | 141 | 136,777 | 13,461,366 |
| HOUSEHOLDS, RACE OF HOUSEHOLDER | |||
| Householder who is White alone | 6,605 | 1,118,798 | 89,754,352 |
| Householder who is Black or African American alone | 70 | 126,729 | 14,129,983 |
| Householder who is American Indian and Alaska Native alone | 15 | 3,856 | 939,707 |
| Householder who is Asian alone | 35 | 41,812 | 4,632,164 |
| Householder who is Native Hawaiian and Other Pacific Islander alone | 1 | 406 | 143,932 |
| Householder who is Some Other Race alone | 28 | 57,489 | 4,916,427 |
| Householder who is Two or More Races | 46 | 21,997 | 2,199,727 |
| HOUSEHOLDS, HOUSEHOLD TYPE BY HOUSEHOLD SIZE | |||
| Family households: Map | 4,055 | 908,661 | 77,538,296 |
| 2-person household Map | 2,189 | 369,216 | 31,882,616 |
| 3-person household Map | 853 | 217,411 | 17,765,829 |
| 4-person household Map | 661 | 193,491 | 15,214,075 |
| 5-person household Map | 259 | 83,677 | 7,411,997 |
| 6-person household Map | 61 | 28,907 | 3,026,278 |
| 7-or-more-person household Map | 32 | 15,959 | 2,237,501 |
| Nonfamily households: Map | 2,745 | 462,426 | 39,177,996 |
| 1-person household Map | 2,226 | 373,648 | 31,204,909 |
| 2-person household Map | 465 | 73,879 | 6,360,012 |
| 3-person household Map | 33 | 9,247 | 992,156 |
| 4-person household Map | 13 | 3,625 | 411,171 |
| 5-person household Map | 5 | 1,239 | 126,634 |
| 6-person household Map | 2 | 441 | 48,421 |
| 7-or-more-person household Map | 1 | 347 | 34,693 |
| HOUSING UNITS | |||
| Total Housing Units Map | 9,406 | 1,487,891 | 131,704,730 |
| HOUSING UNITS, OCCUPANCY STATUS | |||
| Occupied Map | 6,800 | 1,371,087 | 116,716,292 |
| Vacant Map | 2,606 | 116,804 | 14,988,438 |
| HOUSING UNITS, OCCUPIED, TENURE | |||
| Owned with a mortgage or a loan Map | 3,132 | 680,960 | 52,979,430 |
| Owned free and clear Map | 1,701 | 244,326 | 23,006,644 |
| Renter occupied Map | 1,967 | 445,801 | 40,730,218 |
| HOUSING UNITS, VACANT, VACANCY STATUS | |||
| For rent Map | 193 | 40,004 | 4,137,567 |
| Rented, not occupied Map | 23 | 1,960 | 206,825 |
| For sale only Map | 173 | 15,564 | 1,896,796 |
| Sold, not occupied Map | 28 | 3,729 | 421,032 |
| For seasonal, recreational, or occasional use Map | 1,902 | 29,618 | 4,649,298 |
| For migrant workers Map | 2 | 55 | 24,161 |
| Other vacant Map | 285 | 25,874 | 3,652,759 |
| HOUSING UNITS, OCCUPIED, AVERAGE HOUSEHOLD SIZE BY TENURE | |||
| Total: Map | 2.18 | 2.52 | 2.58 |
| Owner occupied Map | 2.27 | 2.64 | 2.65 |
| Renter occupied Map | 1.97 | 2.27 | 2.44 |
| HOUSING UNITS, OCCUPIED, TENURE BY RACE OF HOUSEHOLDER | |||
| Owner occupied: Map | 4,833 | 925,286 | 75,986,074 |
| Householder who is White alone Map | 4,732 | 825,201 | 63,446,275 |
| Householder who is Black or African American alone Map | 34 | 50,482 | 6,261,464 |
| Householder who is American Indian and Alaska Native alone Map | 8 | 1,726 | 509,588 |
| Householder who is Asian alone Map | 25 | 23,507 | 2,688,861 |
| Householder who is Native Hawaiian and Other Pacific Islander alone Map | 1 | 172 | 61,911 |
| Householder who is Some Other Race alone Map | 11 | 14,728 | 1,975,817 |
| Householder who is Two or More Races Map | 22 | 9,470 | 1,042,158 |
| Renter occupied: Map | 1,967 | 445,801 | 40,730,218 |
| Householder who is White alone Map | 1,873 | 293,597 | 26,308,077 |
| Householder who is Black or African American alone Map | 36 | 76,247 | 7,868,519 |
| Householder who is American Indian and Alaska Native alone Map | 7 | 2,130 | 430,119 |
| Householder who is Asian alone Map | 10 | 18,305 | 1,943,303 |
| Householder who is Native Hawaiian and Other Pacific Islander alone Map | 0 | 234 | 82,021 |
| Householder who is Some Other Race alone Map | 17 | 42,761 | 2,940,610 |
| Householder who is Two or More Races Map | 24 | 12,527 | 1,157,569 |
| HOUSING UNITS, OCCUPIED, TENURE BY HISPANIC OR LATINO ORIGIN OF HOUSEHOLDER | |||
| Owner occupied: Map | 4,833 | 925,286 | 75,986,074 |
| Not Hispanic or Latino householder Map | 4,766 | 879,820 | 69,617,625 |
| Hispanic or Latino householder Map | 67 | 45,466 | 6,368,449 |
| Renter occupied: Map | 1,967 | 445,801 | 40,730,218 |
| Not Hispanic or Latino householder Map | 1,893 | 354,490 | 33,637,301 |
| Hispanic or Latino householder Map | 74 | 91,311 | 7,092,917 |
| HOUSING UNITS, OCCUPIED, TENURE BY HOUSEHOLD SIZE | |||
| Owner occupied: Map | 4,833 | 925,286 | 75,986,074 |
| 1-person household Map | 1,300 | 195,555 | 16,453,569 |
| 2-person household Map | 2,094 | 325,808 | 27,618,605 |
| 3-person household Map | 657 | 160,024 | 12,517,563 |
| 4-person household Map | 515 | 150,836 | 10,998,793 |
| 5-person household Map | 192 | 62,773 | 5,057,765 |
| 6-person household Map | 51 | 20,237 | 1,965,796 |
| 7-or-more-person household Map | 24 | 10,053 | 1,373,983 |
| Renter occupied: Map | 1,967 | 445,801 | 40,730,218 |
| 1-person household Map | 926 | 178,093 | 14,751,340 |
| 2-person household Map | 560 | 117,287 | 10,624,023 |
| 3-person household Map | 229 | 66,634 | 6,240,422 |
| 4-person household Map | 159 | 46,280 | 4,626,453 |
| 5-person household Map | 72 | 22,143 | 2,480,866 |
| 6-person household Map | 12 | 9,111 | 1,108,903 |
| 7-or-more-person household Map | 9 | 6,253 | 898,211 |
Loading...